 ar
ar bg
bg hr
hr cs
cs da
da nl
nl fi
fi fr
fr de
de el
el hi
hi it
it ko
ko no
no pl
pl pt
pt ro
ro ru
ru es
es sv
sv tl
tl iw
iw id
id lv
lv lt
lt sr
sr sk
sk sl
sl uk
uk vi
vi et
et hu
hu th
th tr
tr fa
fa ms
ms hy
hy ka
ka ur
ur bn
bn mn
mn ta
ta kk
kk uz
uz ku
ku
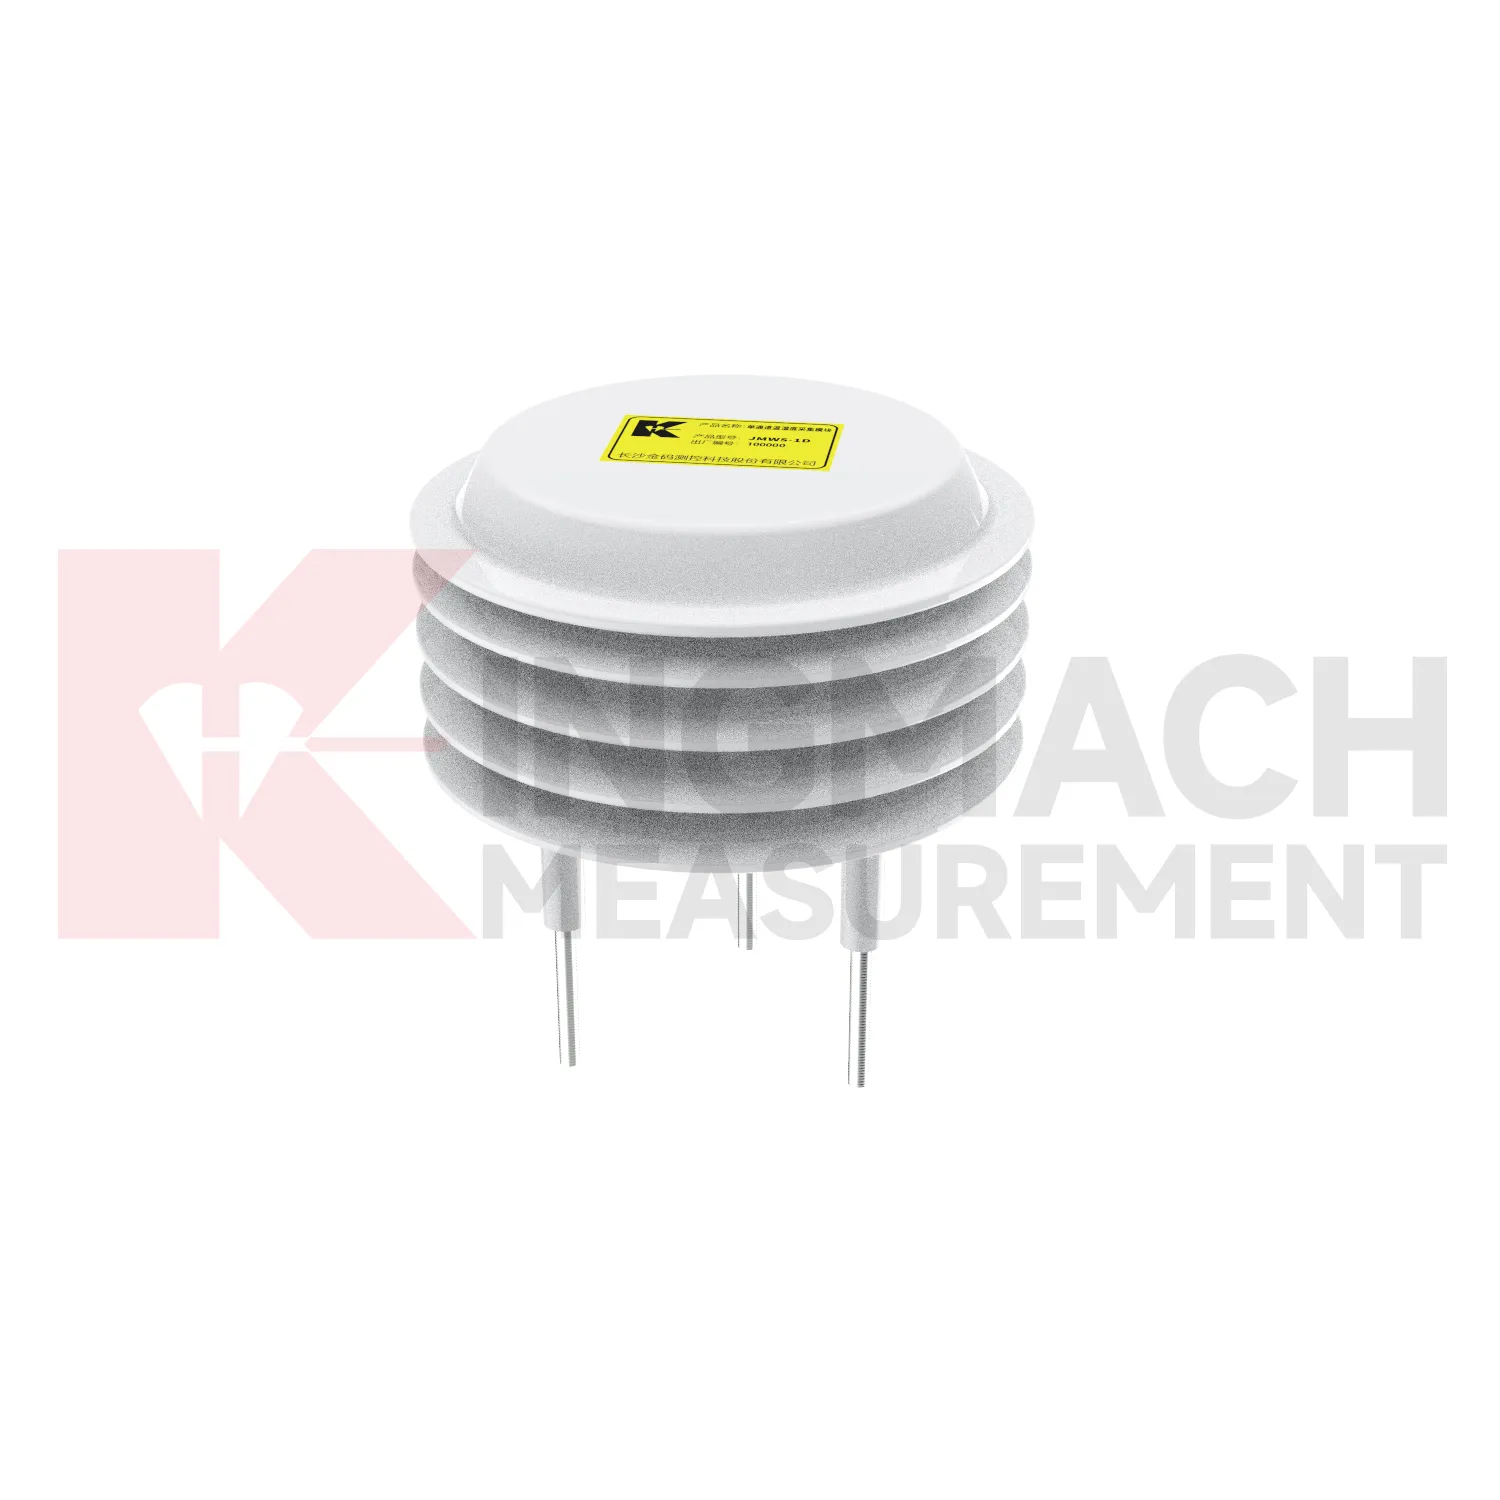
resistance of temperature sensor
Air temperature and humidity monitoring in Kingmach resistance of temperature sensor is useful wherever the environment affects people, equipment, cabinets, sensors, or structural interpretation. Underground stations, tunnels, shopping areas, factories, mines, construction zones, and equipment rooms can change quickly after ventilation adjustments, water entry, heating, cooling, or heavy site activity. A temperature and humidity point should be placed where it represents the condition being reviewed, not simply where installation is easy. If the target is a cabinet, the point belongs near the cabinet environment. If the target is an occupied or underground space, the placement should reflect airflow and working conditions. These records help explain condensation, corrosion, electrical faults, concrete curing context, and changes in other sensor readings. They are also useful for maintenance scheduling because repeated high humidity or heat exposure can shorten the life of connectors, enclosures, and acquisition equipment.
For owners, the strongest record is the one that remains understandable after staff changes. Clear units, plain point names, installation photos, maintenance notes, and linked structural channels make the data usable beyond the original project team.
For field teams, this point is most useful when the record shows the condition before the structural response, during the response, and after the site returns to routine operation. The note should include weather timing, inspection access, nearby construction, and whether the linked structural points changed in the same period.

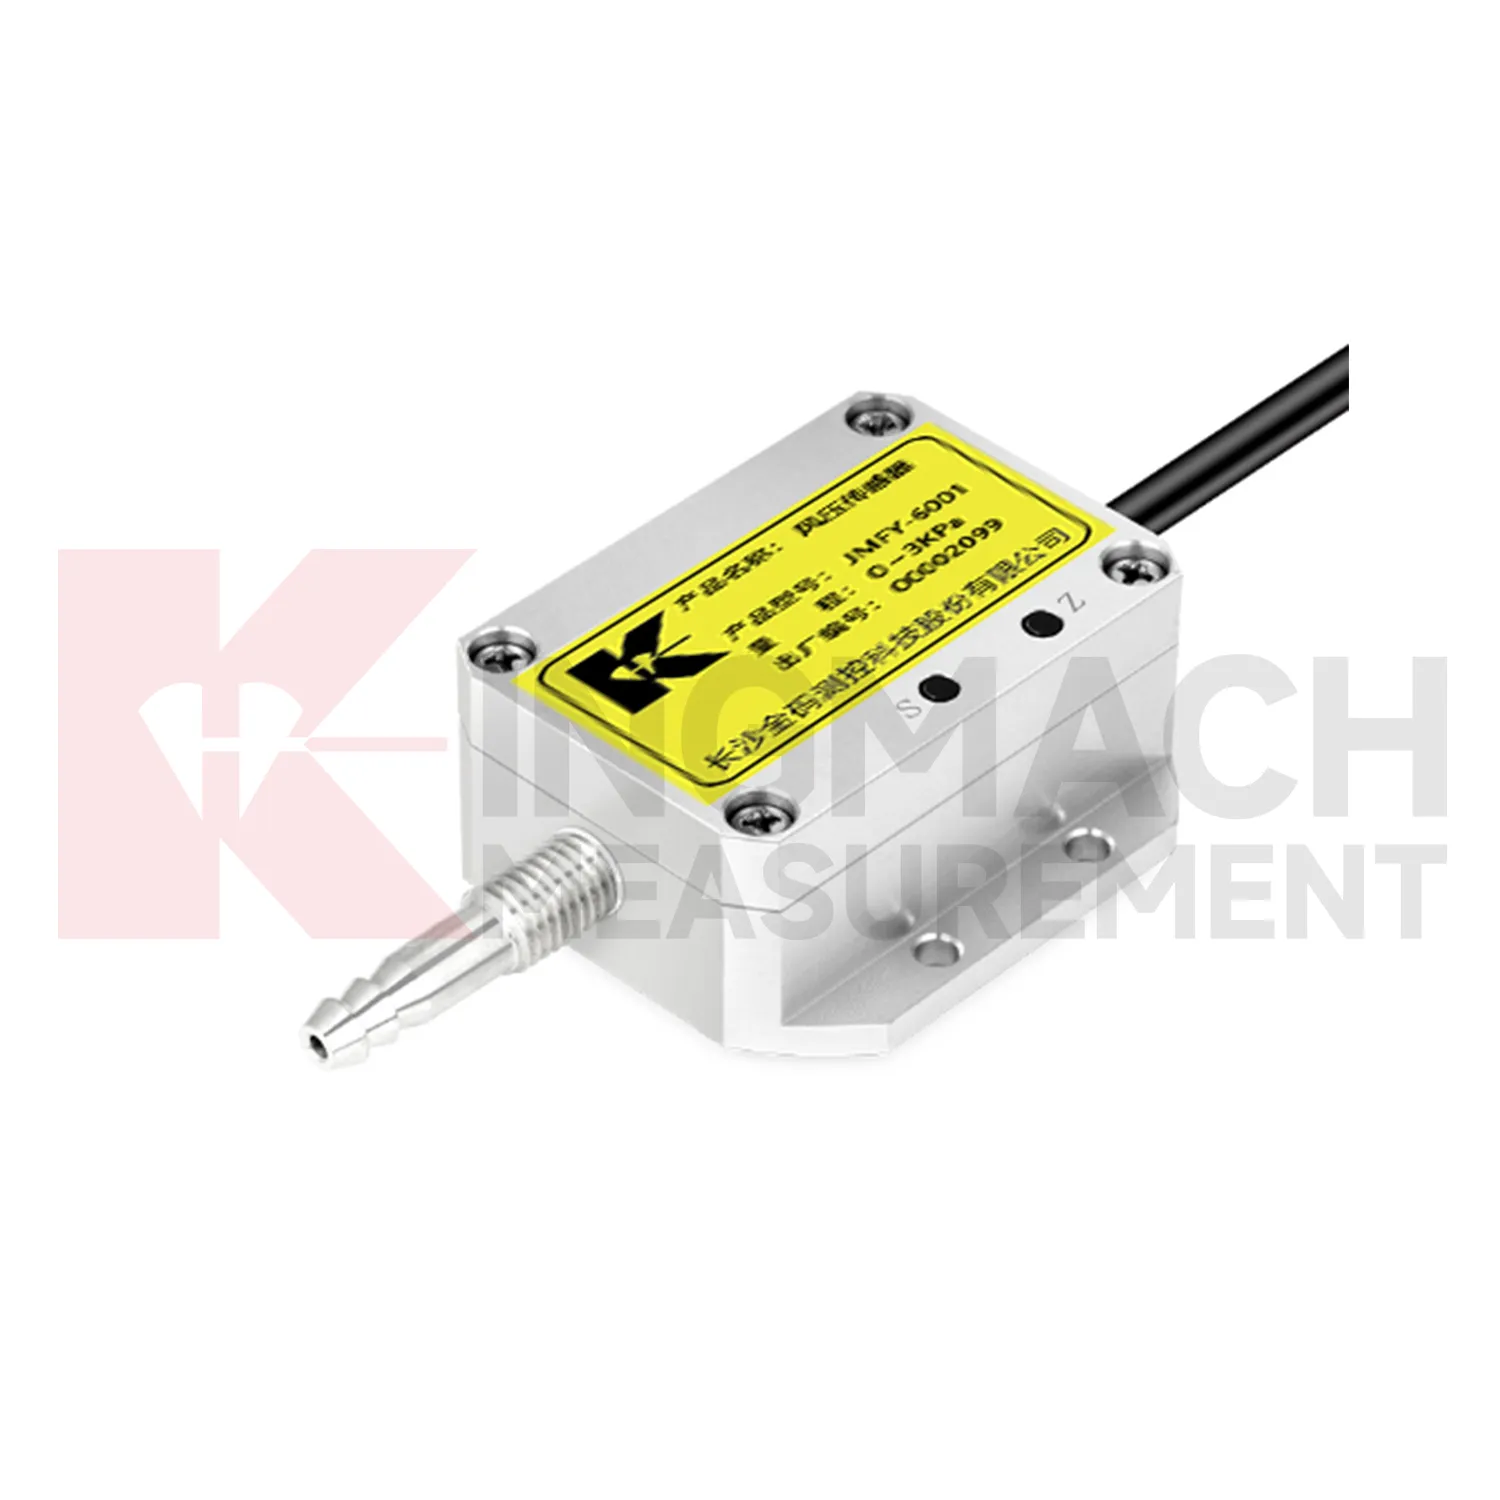
Application of resistance of temperature sensor
Construction sites use Kingmach resistance of temperature sensor to document conditions that affect work, monitoring data, and later dispute review. Rain can change excavation safety, slope behavior, access roads, concrete work, and water management. Wind can affect lifting, temporary structures, and exposed frames. Temperature and humidity can affect curing, equipment rooms, and sensor cabinets. Environmental data should be collected where it represents the active work zone and should be reviewed beside displacement, settlement, vibration, crack, and inspection records. If a movement change occurs after a storm or heavy wind event, the environmental timeline helps engineers explain the timing. It also gives contractors and owners a shared record instead of relying on memory or informal weather notes.
A practical report links the condition value with time, place, and action. It should help a reviewer decide whether to keep observing, inspect the field point, compare nearby instruments, or record the event as normal site behavior.
For owners, the strongest record is the one that remains understandable after staff changes. Clear units, plain point names, installation photos, maintenance notes, and linked structural channels make the data usable beyond the original project team.
For field teams, this point is most useful when the record shows the condition before the structural response, during the response, and after the site returns to routine operation. The note should include weather timing, inspection access, nearby construction, and whether the linked structural points changed in the same period.
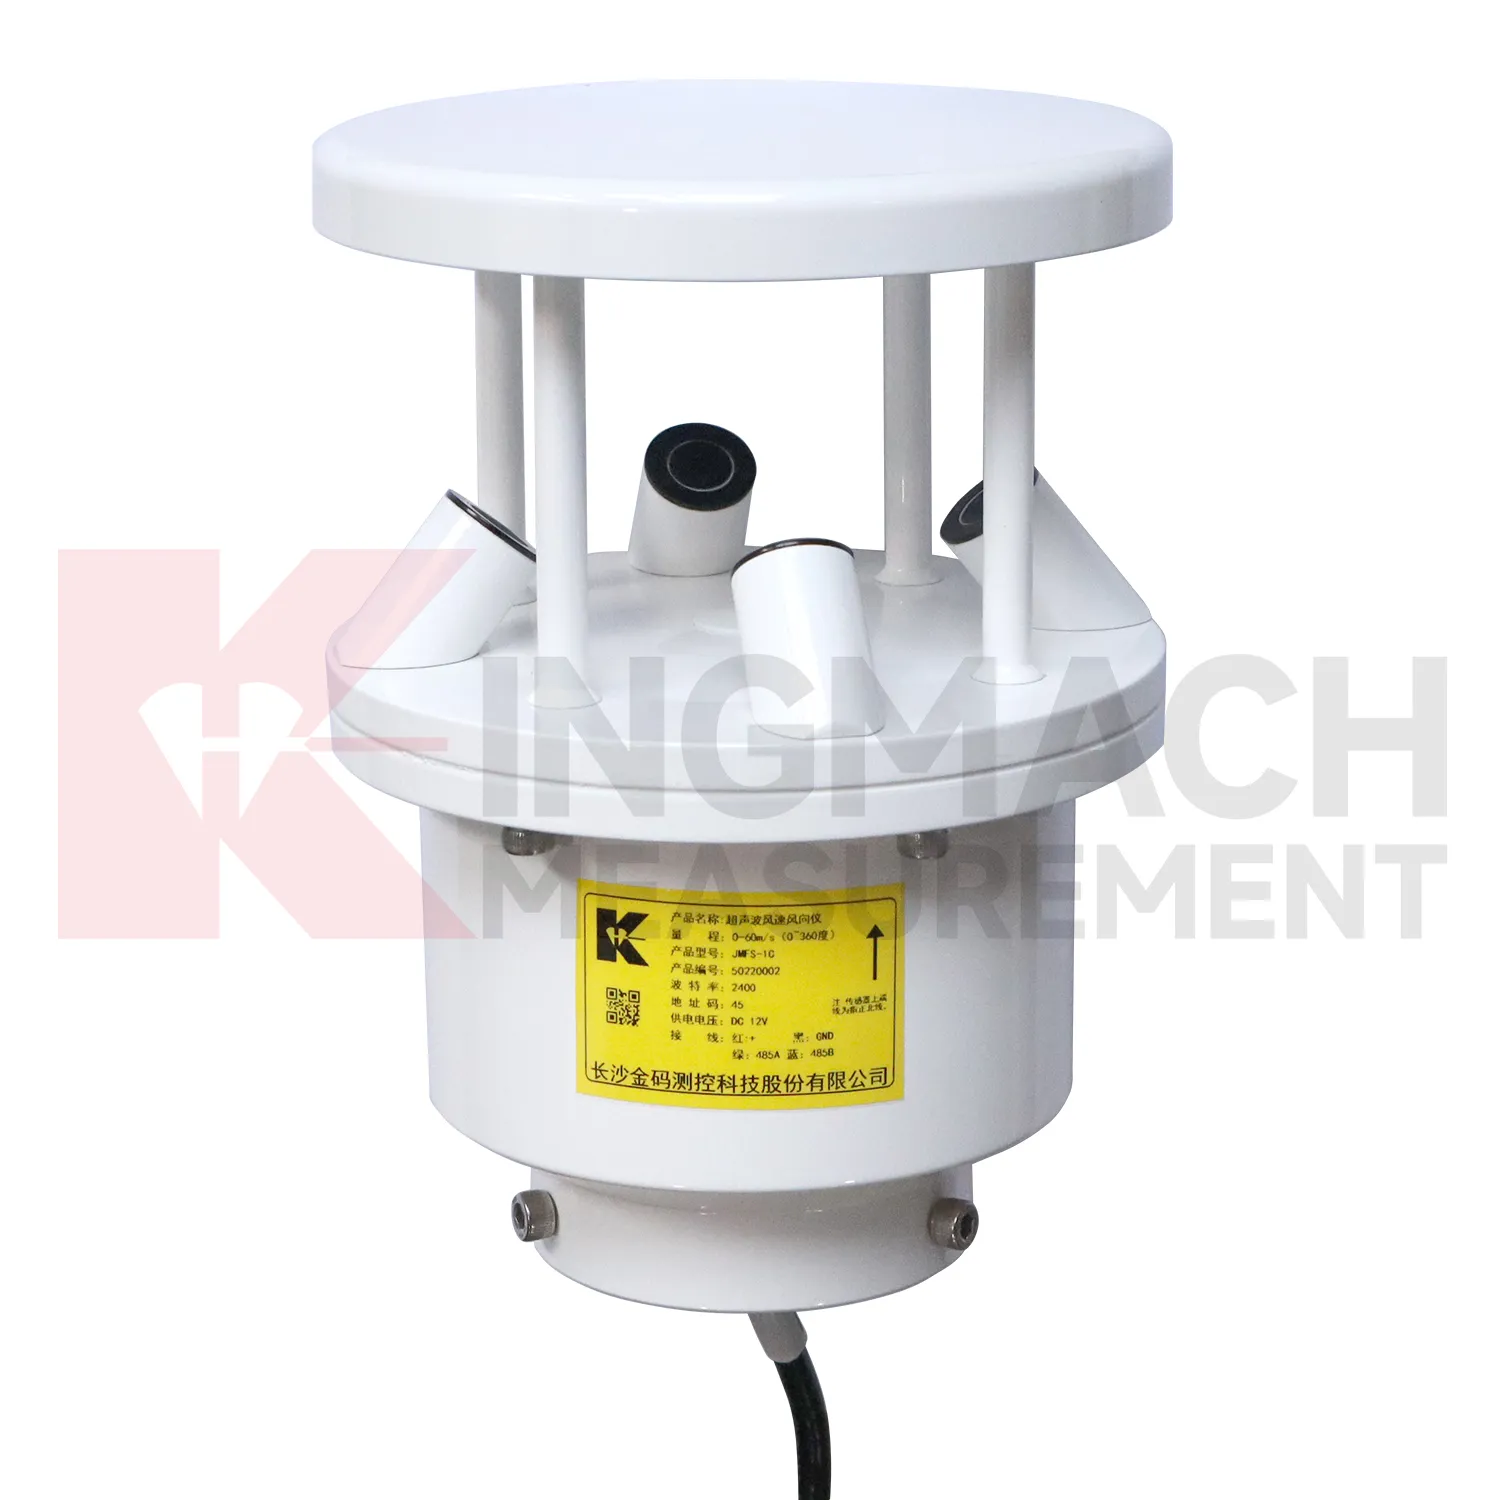
The future of resistance of temperature sensor
Wind context will become a stronger part of future Kingmach resistance of temperature sensor for bridges, towers, airports, marine structures, and high buildings. Wind speed alone is often not enough; direction, gust timing, pressure, temperature, and structural response all matter. Future platforms should connect wind records with acceleration, tilt, displacement, strain, and inspection events. When vibration rises, the reviewer can quickly judge whether it matched known exposure or points to a separate issue. This will improve confidence during storms and high-wind periods. It will also help owners decide when to schedule inspection, restrict access, or compare present response with earlier events.
Wind-event records should also keep exposure notes, station height, nearby obstructions, and maintenance access visible. A sensor mounted on a roof edge, bridge tower, airport mast, or coastal structure may see very different airflow from a sheltered point nearby. Future reporting should make that difference clear so teams do not compare unrelated wind records as if they represent the same condition.
For long-term review, repeated wind events can become a useful operating history. Owners can compare similar wind directions across seasons, check whether structural response remains stable, and decide whether an inspection is needed after a severe event. That turns wind monitoring into a maintenance planning tool rather than only a weather record.
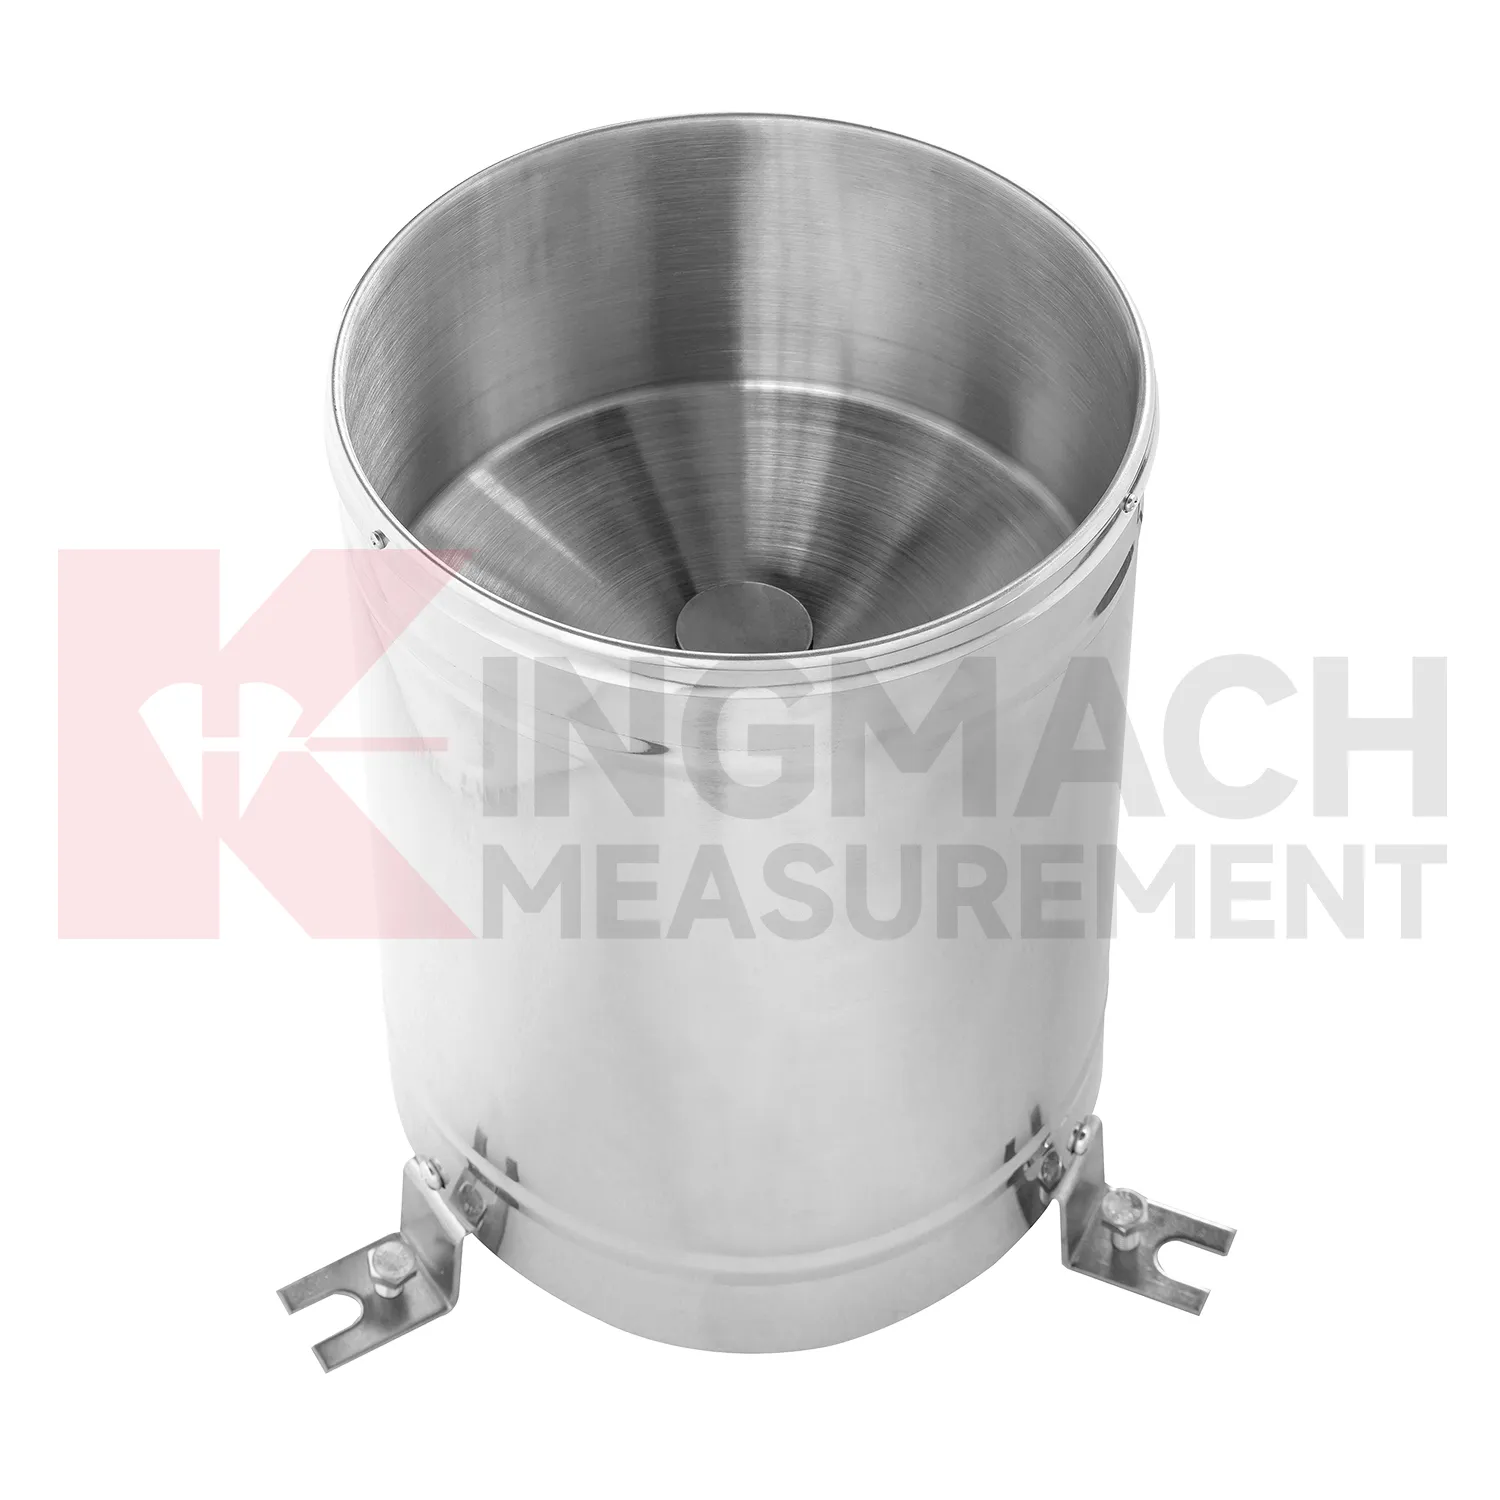
Care & Maintenance of resistance of temperature sensor
Wind-station maintenance for Kingmach resistance of temperature sensor should preserve exposure and mounting stability. Check for new obstructions, loose poles, tilted brackets, damaged connectors, lightning effects, corrosion, ice, salt, dust, and cable strain. The wind point should represent the monitored bridge, tower, airport area, marine site, tunnel portal, or construction zone. If a nearby structure, scaffold, crane, or temporary cover changes airflow, the record may no longer explain the asset. Maintenance notes should state what was inspected, what was cleaned, and whether the first readings after work looked normal. Reliable wind data depends on both instrument condition and a clear flow path.
A good review habit is to compare the condition channel with the nearest asset behavior instead of reading it as a standalone weather value. That keeps the record tied to slope movement, bridge response, tunnel equipment, dam seepage, drainage behavior, or cabinet reliability.
The installation file should explain why the location represents the monitored area. If the point is sheltered, shaded, exposed, buried, elevated, or placed inside an enclosure, that fact changes how later readings should be understood by maintenance staff.
Kingmach resistance of temperature sensor
Wind exposure makes Kingmach resistance of temperature sensor relevant to bridges, towers, airports, marine areas, tunnels, and high outdoor structures. Wind speed, direction, and pressure can affect vibration, access safety, temporary works, lifting operations, and inspection planning. A bridge response during strong crosswind should not be read the same way as a response during calm weather. A tower vibration record means more when the wind direction and timing are known. Wind data should be placed where it represents the monitored asset, with attention to height, obstruction, mounting stability, and cable protection. A clean wind record gives engineers a way to separate normal weather-driven response from behavior that needs a closer structural review.
For field teams, this point is most useful when the record shows the condition before the structural response, during the response, and after the site returns to routine operation. The note should include weather timing, inspection access, nearby construction, and whether the linked structural points changed in the same period.
FAQ
Q: Can environmental data support asset management?
A: Yes. Long-term records help owners compare weather, exposure, maintenance events, and structural response across seasons and assets.
Q: How does it help during alarms?
A: It lets reviewers check whether a structural alarm followed rain, wind, temperature change, humidity rise, or another site condition.
Q: What should dashboards show?
A: Dashboards should link environmental channels to the structural risks they explain, rather than displaying unrelated values together.
Q: Why avoid product-list writing?
A: Readers need to understand monitoring purpose and field value; long product lists make the page harder to use and less natural.
Q: What is the best review habit?
A: Review environmental data with time-aligned structural readings, inspection notes, maintenance records, and the site event that triggered concern.
If the reading seems unusual, the team should check the physical condition of the station before drawing conclusions about the asset. Blockage, poor exposure, loose wiring, water entry, and changed surroundings can all create misleading patterns.
Reviews
David Wilson
We purchased displacement transducers and settlement sensors, and the quality exceeded our expectations. Easy installation and reliable performance.
Michael Anderson
The strain gauges and load cells are extremely accurate and stable. They performed very well in our bridge monitoring project. Highly recommended!
Latest Inquiries
To protect the privacy of our buyers, only public service email domains like Gmail, Yahoo, and MSN will be displayed. Additionally, only a limited portion of the inquiry content will be shown.
Mia***@gmail.comNetherlands
Dear team, we are interested in your readouts & data loggers compatible with multiple sensors. Do yo...
Evelyn***@gmail.comSouth Africa
Hi, we are a contractor working on tunnel construction and need settlement sensors and displacement ...
Related product categories
- tipping bucket rain gauge 0.2 mm resolution standard
- tipping bucket rain gauge data logger
- tipping bucket rain gauge resolution 0.1 mm typical
- tipping bucket rain gauge resolution 0.2 mm typical
- tipping bucket rain gauge typical resolution 0.2 mm standard
- typical tipping bucket rain gauge resolution 0.2 mm standard
- Temperature Sensor
- Chain-type Temperature Sensor
- Temperature String
- Daisy-Chained Digital Thermometer
- Single-Channel Temperature and Humidity Acquisition Module
- Environmental Monitoring