 ar
ar bg
bg hr
hr cs
cs da
da nl
nl fi
fi fr
fr de
de el
el hi
hi it
it ko
ko no
no pl
pl pt
pt ro
ro ru
ru es
es sv
sv tl
tl iw
iw id
id lv
lv lt
lt sr
sr sk
sk sl
sl uk
uk vi
vi et
et hu
hu th
th tr
tr fa
fa ms
ms hy
hy ka
ka ur
ur bn
bn mn
mn ta
ta kk
kk uz
uz ku
ku
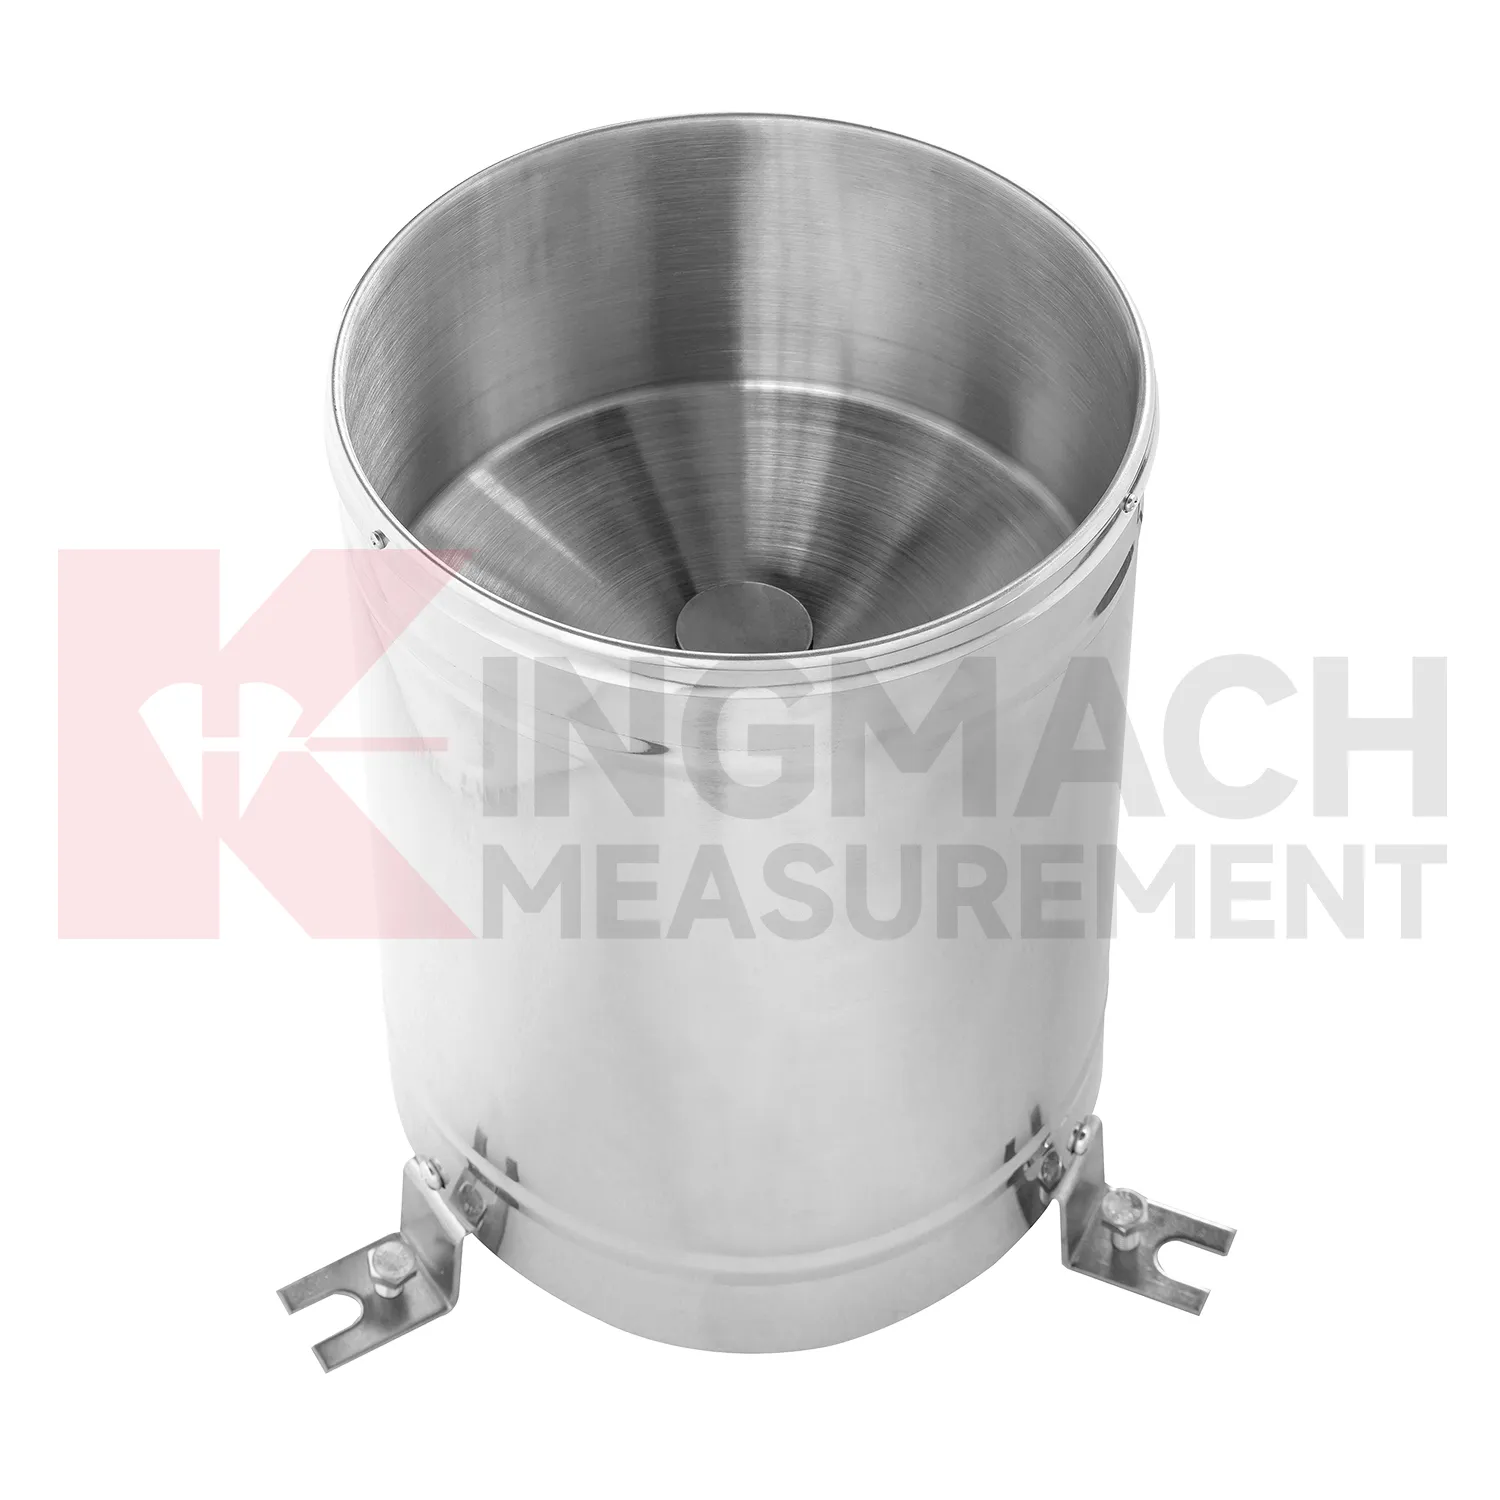
tipping bucket rain gauges
Wind monitoring in Kingmach tipping bucket rain gauges helps explain dynamic response and site exposure on bridges, towers, airports, marine facilities, tunnel portals, urban stations, and wind-sensitive construction areas. Wind values are most useful when the station placement represents the asset being reviewed. A sensor behind a wall or below a sheltered deck may produce neat data but fail to explain the structure. Engineers often need to know direction as well as speed because crosswind, headwind, gusts, and local shielding create different responses. Wind records should be reviewed with vibration, tilt, strain, displacement, pressure, access restrictions, and inspection timing. In exposed environments, maintenance teams also need to understand whether ice, salt, dust, or lightning may have affected the station. The environmental record becomes stronger when it shows both the weather condition and the reliability of the measurement point.
The environmental point should be part of a named monitoring question. It may explain wetting, drying, wind exposure, thermal movement, cabinet stress, or pressure variation, but that purpose needs to be visible in drawings and reports.
If the reading seems unusual, the team should check the physical condition of the station before drawing conclusions about the asset. Blockage, poor exposure, loose wiring, water entry, and changed surroundings can all create misleading patterns.
A practical report links the condition value with time, place, and action. It should help a reviewer decide whether to keep observing, inspect the field point, compare nearby instruments, or record the event as normal site behavior.
Application of tipping bucket rain gauges
Bridge projects use Kingmach tipping bucket rain gauges to understand the conditions that surround structural response. Wind can drive vibration and deck movement. Temperature can affect expansion, strain, and displacement. Humidity and rain can influence cabinets, connectors, corrosion, and inspection timing. A bridge record becomes more useful when environmental channels are aligned with traffic, strain, acceleration, tilt, settlement, and visual inspection data. Placement matters: wind data should represent the bridge exposure, temperature should match the structural or air condition being reviewed, and cabinet humidity should be measured near the equipment it may affect. During a vibration alarm, engineers can check whether the event matched strong wind, temperature swing, heavy rain, or unusual traffic. That context helps separate normal operating response from behavior that deserves a field review.
The environmental point should be part of a named monitoring question. It may explain wetting, drying, wind exposure, thermal movement, cabinet stress, or pressure variation, but that purpose needs to be visible in drawings and reports.
If the reading seems unusual, the team should check the physical condition of the station before drawing conclusions about the asset. Blockage, poor exposure, loose wiring, water entry, and changed surroundings can all create misleading patterns.
A practical report links the condition value with time, place, and action. It should help a reviewer decide whether to keep observing, inspect the field point, compare nearby instruments, or record the event as normal site behavior.
The future of tipping bucket rain gauges
Maintenance analytics will shape future Kingmach tipping bucket rain gauges. A rain point can clog, a soil point can lose contact, a wind point can become sheltered by new equipment, and a humidity point can be affected by cabinet changes. Future platforms can flag flatlines, impossible jumps, missing intervals, and disagreement between related channels. These checks will not replace field inspection, but they will tell teams where to look first. This is especially useful on large projects with many stations. Data quality alerts help prevent months of unreliable environmental records from being accepted as real site behavior.
The maintenance view should be different from the engineering alarm view. It should show station health, last inspection, cleaning history, power condition, enclosure status, and whether nearby site changes may have altered exposure. That helps field crews prioritize practical work before data quality falls.
Over time, maintenance analytics can reveal weak points in the monitoring network itself. If one station repeatedly needs cleaning, loses communication, or disagrees with nearby conditions, the owner can decide whether to improve access, change protection, or move the point to a better location.
Care & Maintenance of tipping bucket rain gauges
Rainfall maintenance for Kingmach tipping bucket rain gauges should focus on keeping the catchment path clean and level. Leaves, dust, insects, scale, bird droppings, splash, and tilted mounting can distort rainfall records. The rain point should be inspected after storms, long dry periods, nearby earthwork, and seasonal debris build-up. Cleaning should be logged with date, condition, leveling status, and the first normal reading after work. Rainfall data is often used to explain slope movement, seepage, tunnel leakage, construction delay, or drainage performance. If the rain record is wrong, the engineering interpretation may also be wrong. Simple field care protects a much larger monitoring decision.
Maintenance teams should record cleaning, access difficulty, enclosure condition, cable repair, vegetation growth, nearby equipment changes, and the first normal reading after work. Those notes protect the meaning of the curve when old data is reviewed months later.
The environmental point should be part of a named monitoring question. It may explain wetting, drying, wind exposure, thermal movement, cabinet stress, or pressure variation, but that purpose needs to be visible in drawings and reports.
Kingmach tipping bucket rain gauges
Kingmach tipping bucket rain gauges helps engineering teams read the conditions around a structure before they judge the structure itself. Temperature, humidity, rainfall, wind, pressure, and soil wetness can all change how bridges, tunnels, slopes, buildings, dams, and construction sites behave. A deformation curve after a storm is different from the same curve during a dry week. A strain record during a heat wave needs a temperature background. A cabinet fault in a tunnel may have more to do with moisture than with the instrument connected to it. The purpose of this category is to make those surrounding conditions visible. When environmental records sit beside settlement, displacement, tilt, load, vibration, and inspection notes, engineers can explain why a reading changed instead of only seeing that it changed.
For field teams, this point is most useful when the record shows the condition before the structural response, during the response, and after the site returns to routine operation. The note should include weather timing, inspection access, nearby construction, and whether the linked structural points changed in the same period.
FAQ
Q: Can environmental data support asset management?
A: Yes. Long-term records help owners compare weather, exposure, maintenance events, and structural response across seasons and assets.
Q: How does it help during alarms?
A: It lets reviewers check whether a structural alarm followed rain, wind, temperature change, humidity rise, or another site condition.
Q: What should dashboards show?
A: Dashboards should link environmental channels to the structural risks they explain, rather than displaying unrelated values together.
Q: Why avoid product-list writing?
A: Readers need to understand monitoring purpose and field value; long product lists make the page harder to use and less natural.
Q: What is the best review habit?
A: Review environmental data with time-aligned structural readings, inspection notes, maintenance records, and the site event that triggered concern.
If the reading seems unusual, the team should check the physical condition of the station before drawing conclusions about the asset. Blockage, poor exposure, loose wiring, water entry, and changed surroundings can all create misleading patterns.
Reviews
Andrew Lee
The visualization software is intuitive and powerful. It helps us analyze monitoring data efficiently.
Christopher Martinez
Very satisfied with the readouts & data loggers. User-friendly interface and supports multiple sensor inputs.
Latest Inquiries
To protect the privacy of our buyers, only public service email domains like Gmail, Yahoo, and MSN will be displayed. Additionally, only a limited portion of the inquiry content will be shown.
Evelyn***@gmail.comSouth Africa
Hi, we are a contractor working on tunnel construction and need settlement sensors and displacement ...
Harper***@gmail.comIndia
Dear Sir, we are planning to procure a complete monitoring system including strain gauges, tiltmeter...
Related product categories
- Temperature Sensor
- Chain-type Temperature Sensor
- Temperature String
- Daisy-Chained Digital Thermometer
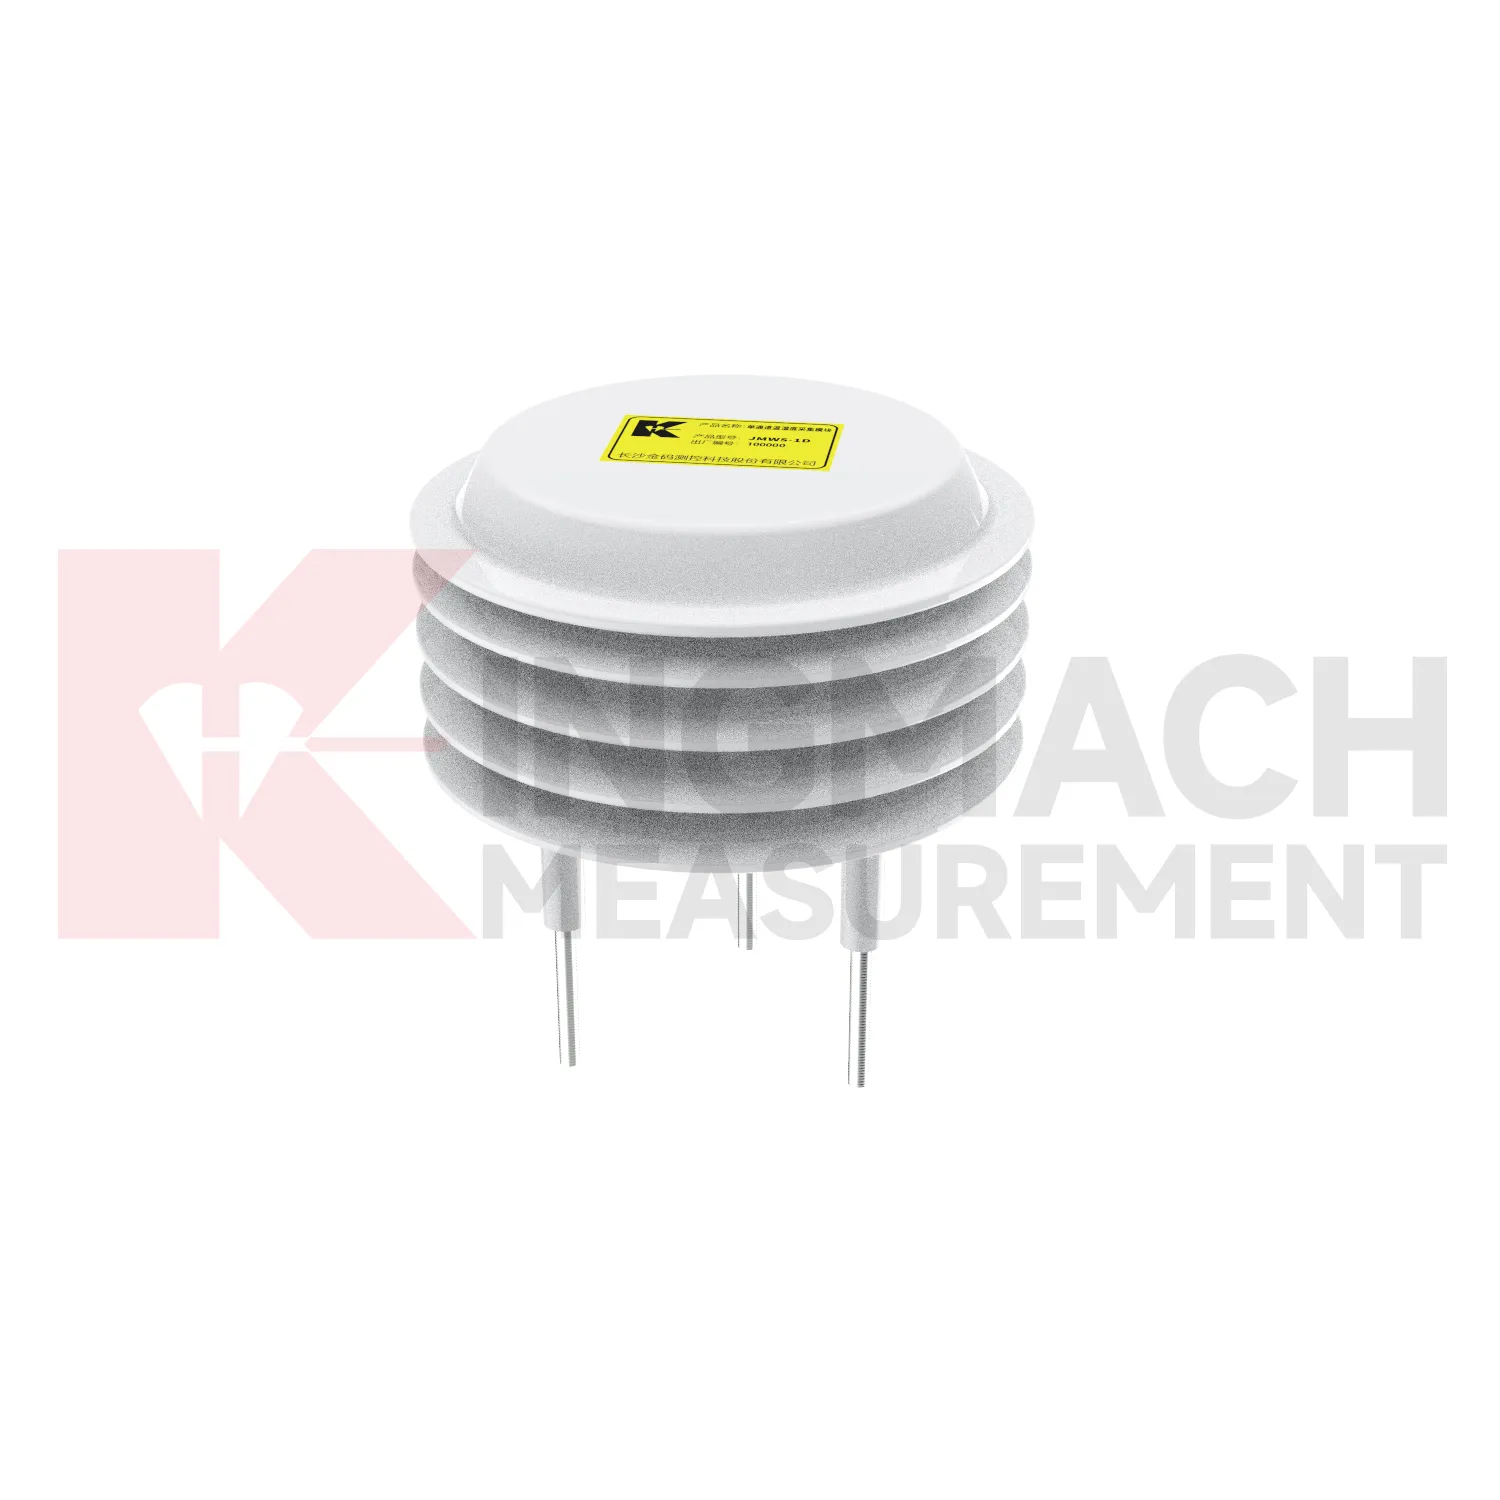
- Single-Channel Temperature and Humidity Acquisition Module
- Environmental Monitoring
- Integrated Monitoring Station
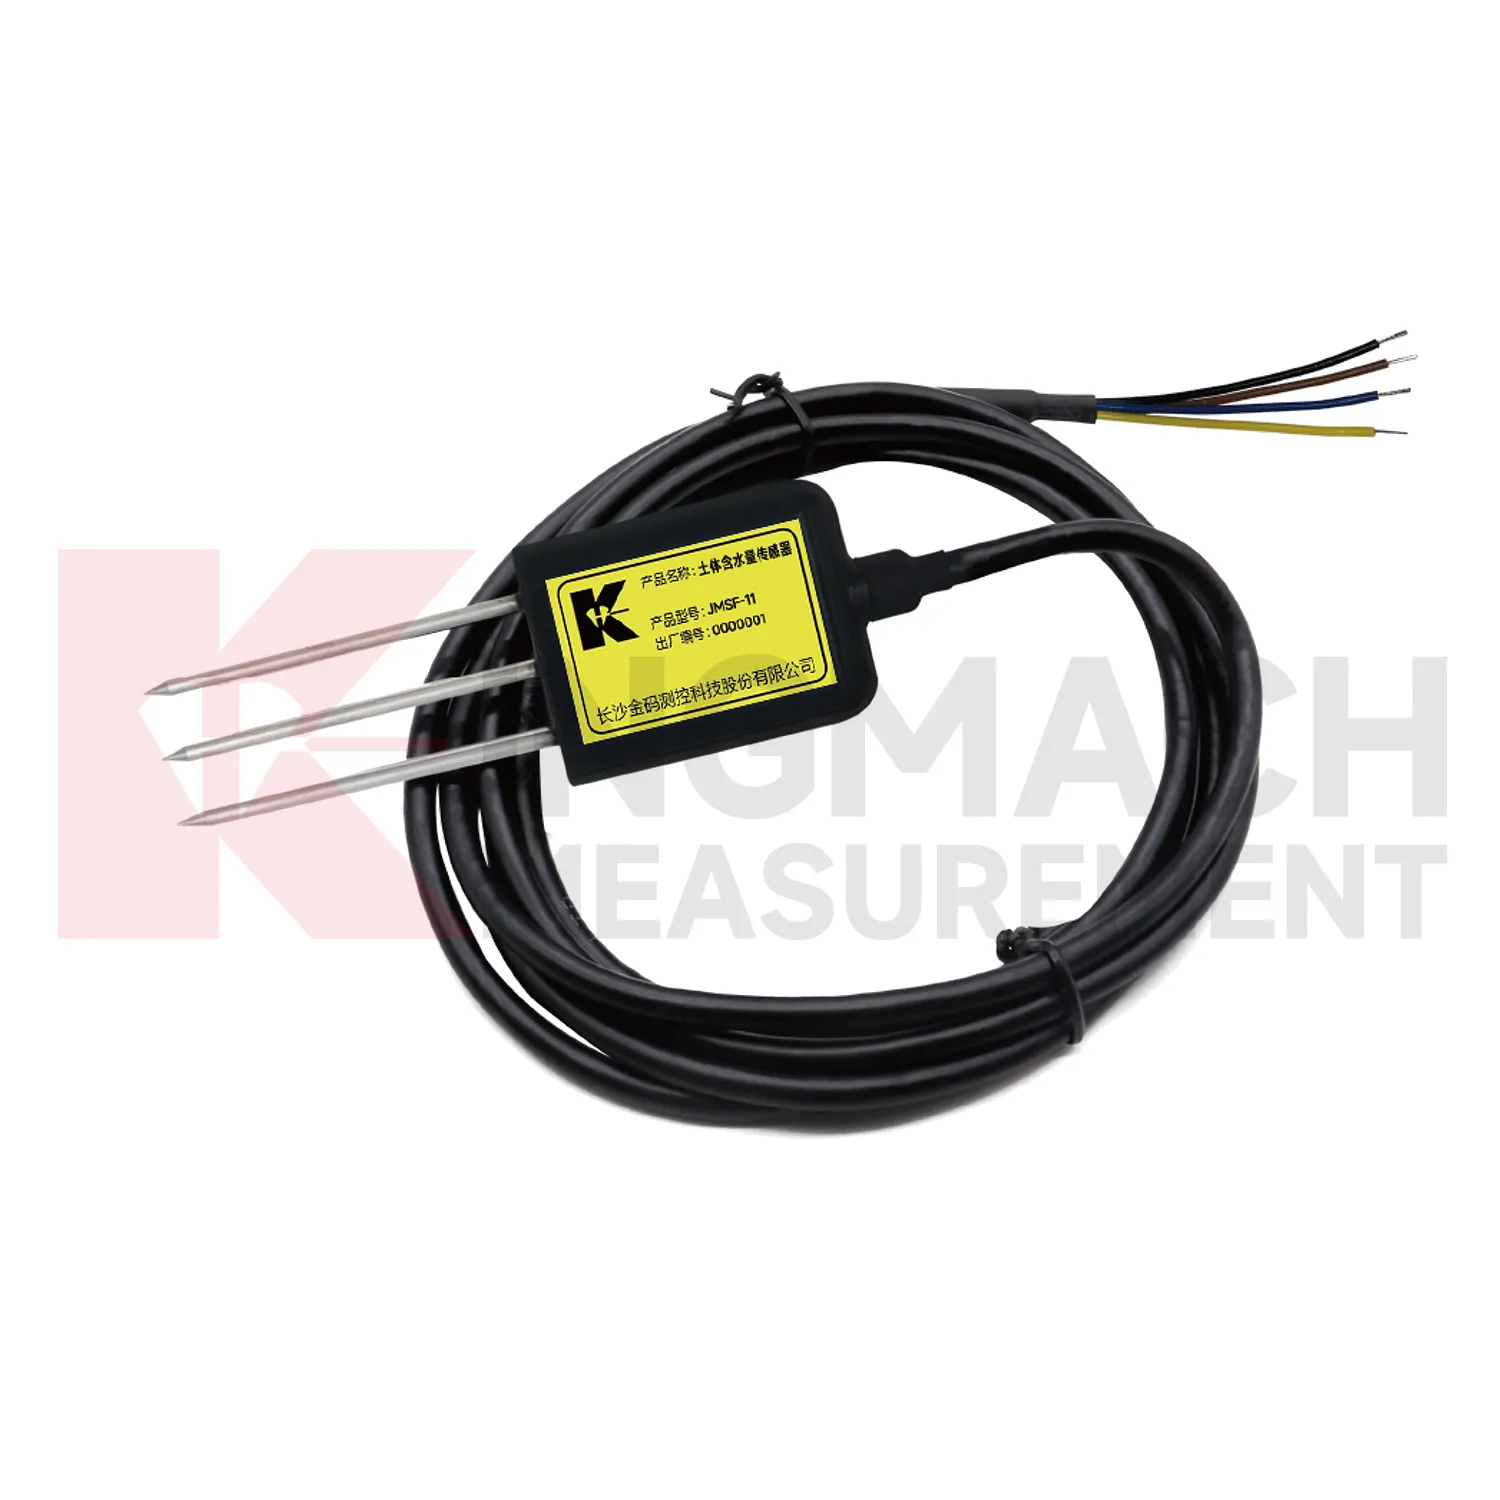
- Soil Water Content Sensor
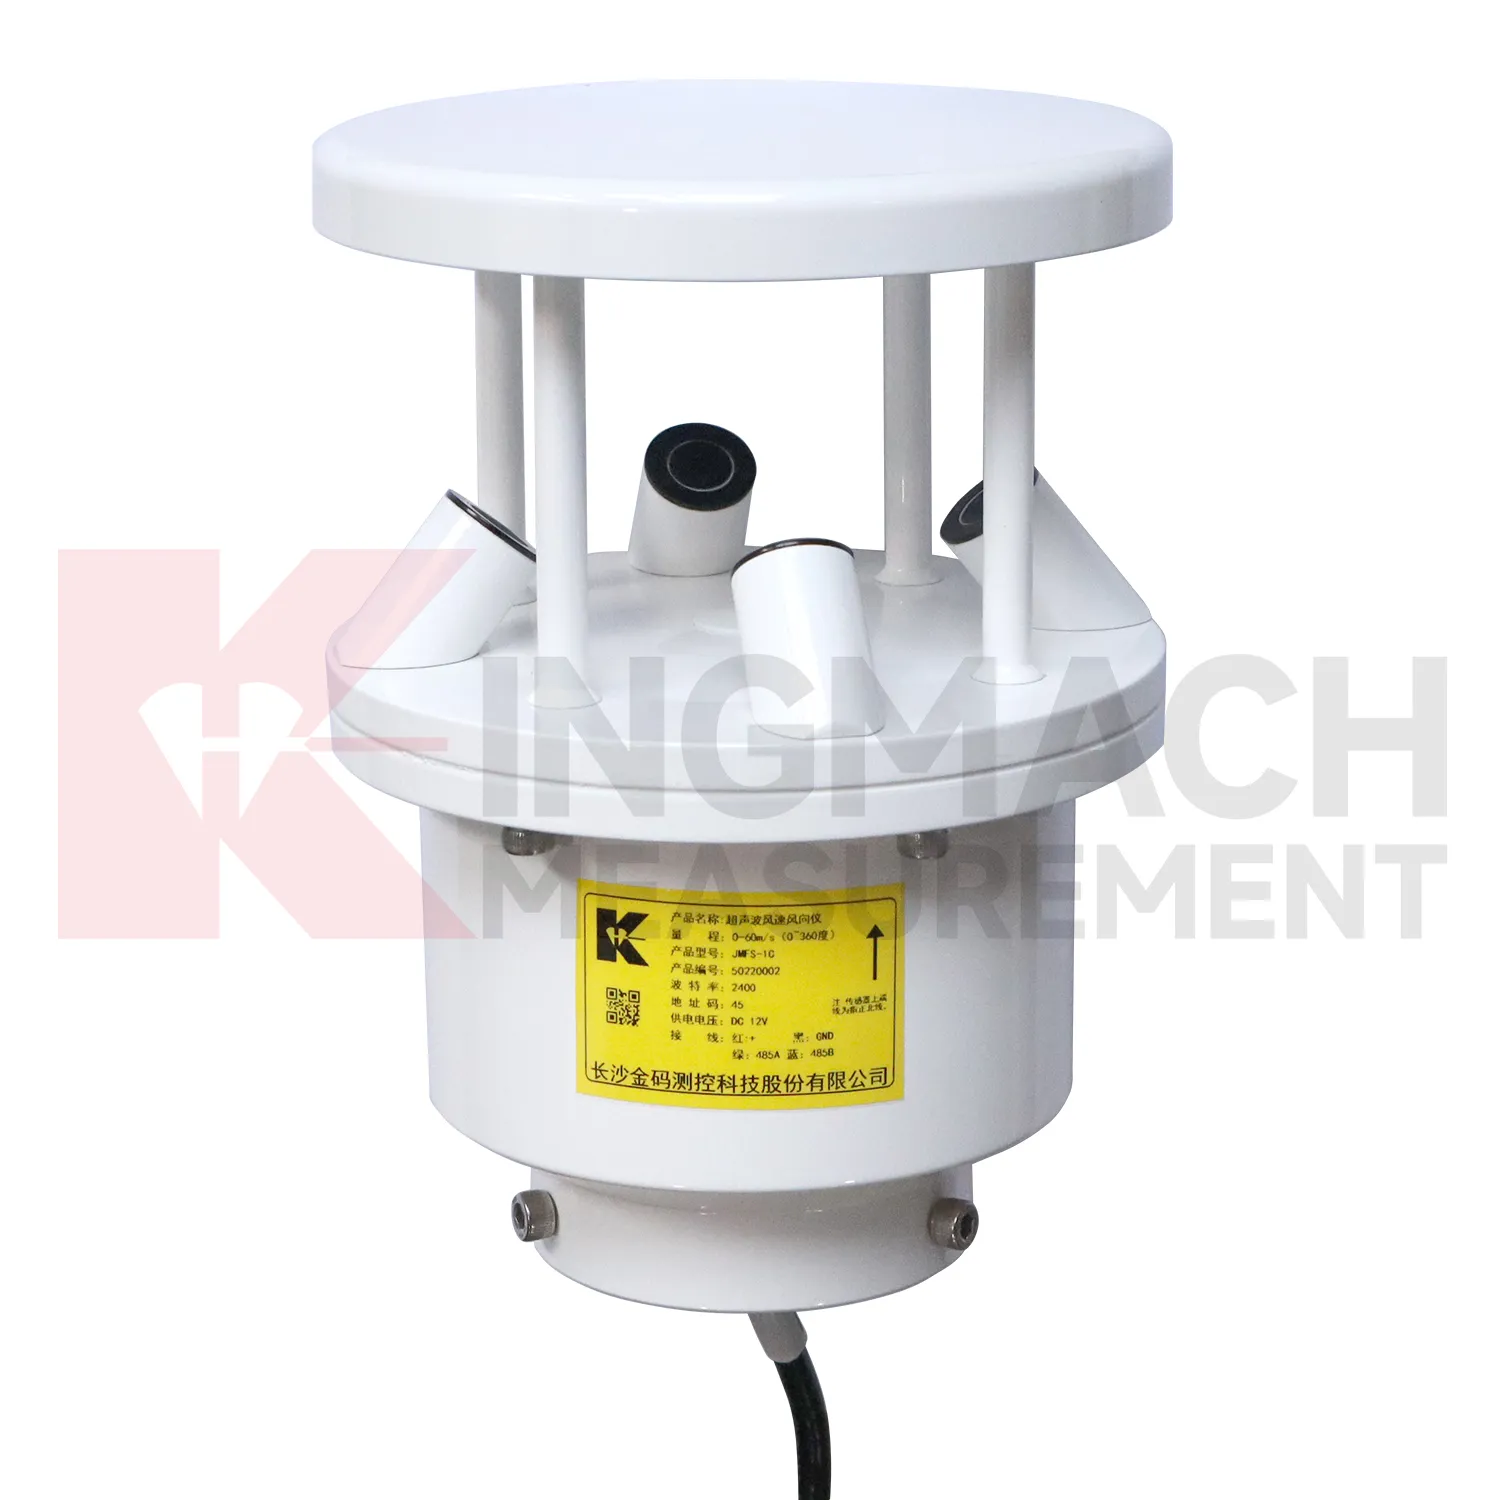
- Ultrasonic Anemometer
- semiconductor temperature sensor
- semiconductor based temperature sensors
- semiconductor temperature sensors